How to display a Google Pie Chart with PHP
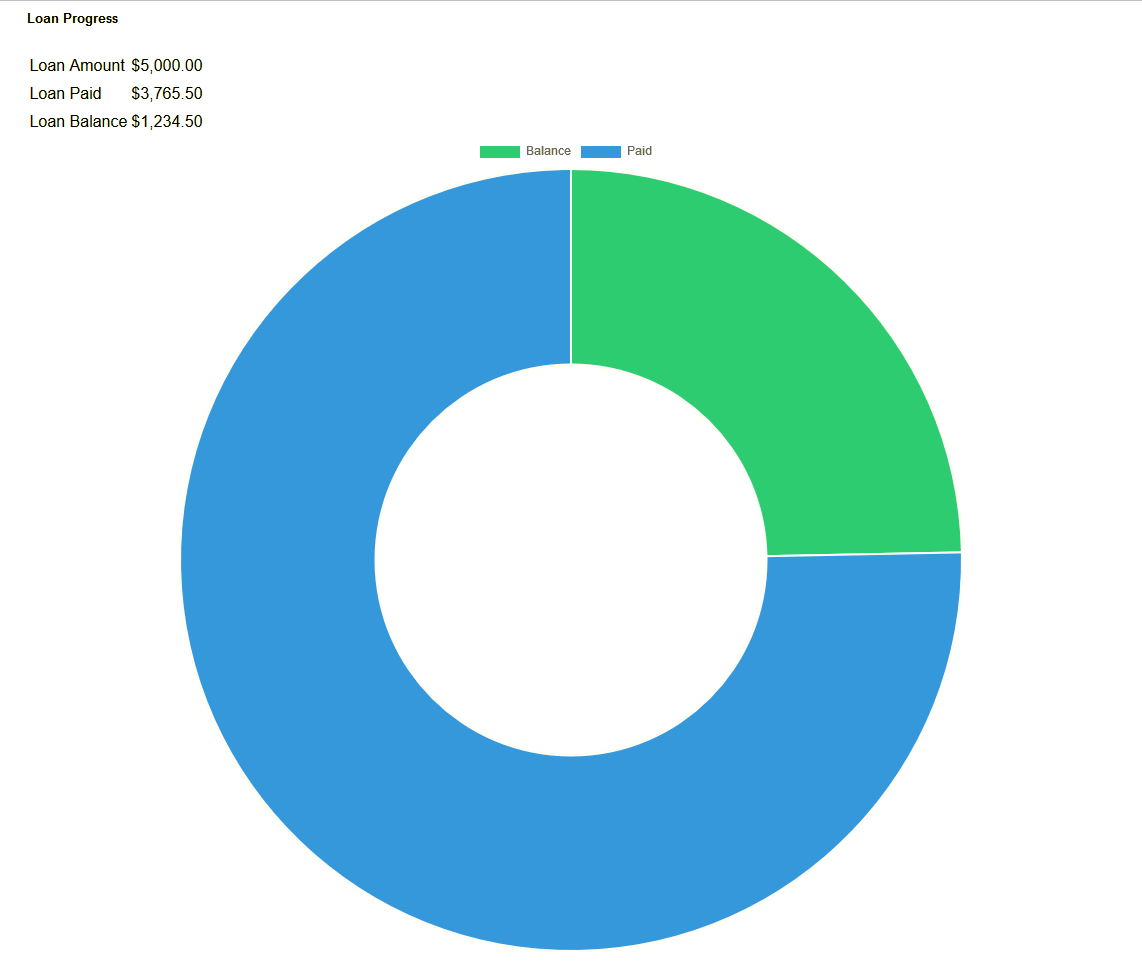
 Pie charts are a great way to display data in an appealing manner. Google charts are easy to implement and offer the user a colorful, interactive experience. The user can hover over sections of the chart to reveal specifics. The following example shows how to render a very simple Google donut style pie chart with two simple values. Our chart will show loan balance amount and loan paid amount effectively displaying the progress made against the loan.
Google offers a variety of charts each with the ability to customize the colors, values, sizes, etc. Reference Google Charts for more information.
For the purpose of this post, we’re going to display a very simple donut pie chart.
Before we display the chart we display a table of information showing the original loan amount, the amount paid, and the balance remaining. We then follow that up with an attractive donut pie chart in green and blue. We can control the size of the chart by adding height and width settings to a div that contains the chart. In our case, we’ve set the container to 400 x 400 pixels. In our example, we’ve hard-coded the values for simplicity. You would likely pull these from a database.
<style>
.container {
	width: 400px;
	height: 400px;
}
</style>

<?php

	$loan_amount = 5000.00;
	$loan_paid = 3765.50;
	$loan_balance = 1234.50;

// google chart script reference

	echo "<script src='https://cdnjs.cloudflare.com/ajax/libs/Chart.js/2.1.4/Chart.min.js'></script>\n";

// display the loan values

	echo "			<div class='container'>\n";
	echo "			  <h5>Loan Progress</h5>\n";
	echo "			  <table>\n";
	echo "			  	<tr><td>Loan Amount</td><td align='right'>$" . number_format($loan_amount,2) . "</td></tr>\n";
	echo "			  	<tr><td>Loan Paid</td><td align='right'>$" . number_format($loan_paid,2) . "</td></tr>\n";
	echo "			  	<tr><td>Loan Balance</td><td align='right'>$" . number_format($loan_balance,2) . "</td></tr>\n";
	echo "			  </table>\n";
	echo "			  <div style='width:400px; height:400px;'>\n";
	echo "			    <canvas id='myChart' width='400' height='300'></canvas>\n";
	echo "			  </div>\n";
	echo "			</div>\n";

// pie chart

	echo "<script type='text/javascript'>\n";
	echo "	var ctx = document.getElementById('myChart').getContext('2d');\n";
	echo "	var myChart = new Chart(ctx, {\n";
	echo "		type: 'doughnut',\n";
	echo "		data: {\n";
	echo "			labels: ['Balance', 'Paid'],\n";
	echo "			datasets: [{\n";
	echo "				backgroundColor: [\n";
	echo "				'#2ecc71',\n";
	echo "				'#3498db'\n";
	echo "			],\n";
	echo "			data: [$loan_balance, $loan_paid]\n";
	echo "			}]\n";
	echo "		}\n";
	echo "	});\n";
	echo "</script>\n";


?>
![]()
Click Here for a Working Example
Example Result:

